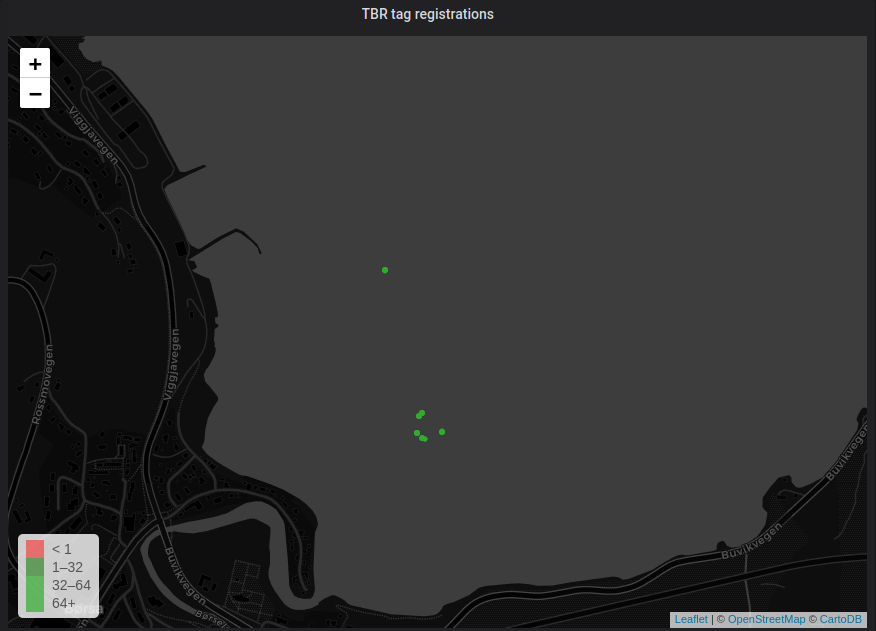
Online Data Visualization
To share telemetry from the vessel, such as acoustic tag detection's, a online data visualization solution has been developed and deployed. Its main component is the time-series database InfluxDB, combined with the analytics and monitoring solution Grafana. This provides near real-time monitoring of the system telemetry for participating researchers.
